Categories
Understanding the Dashboard
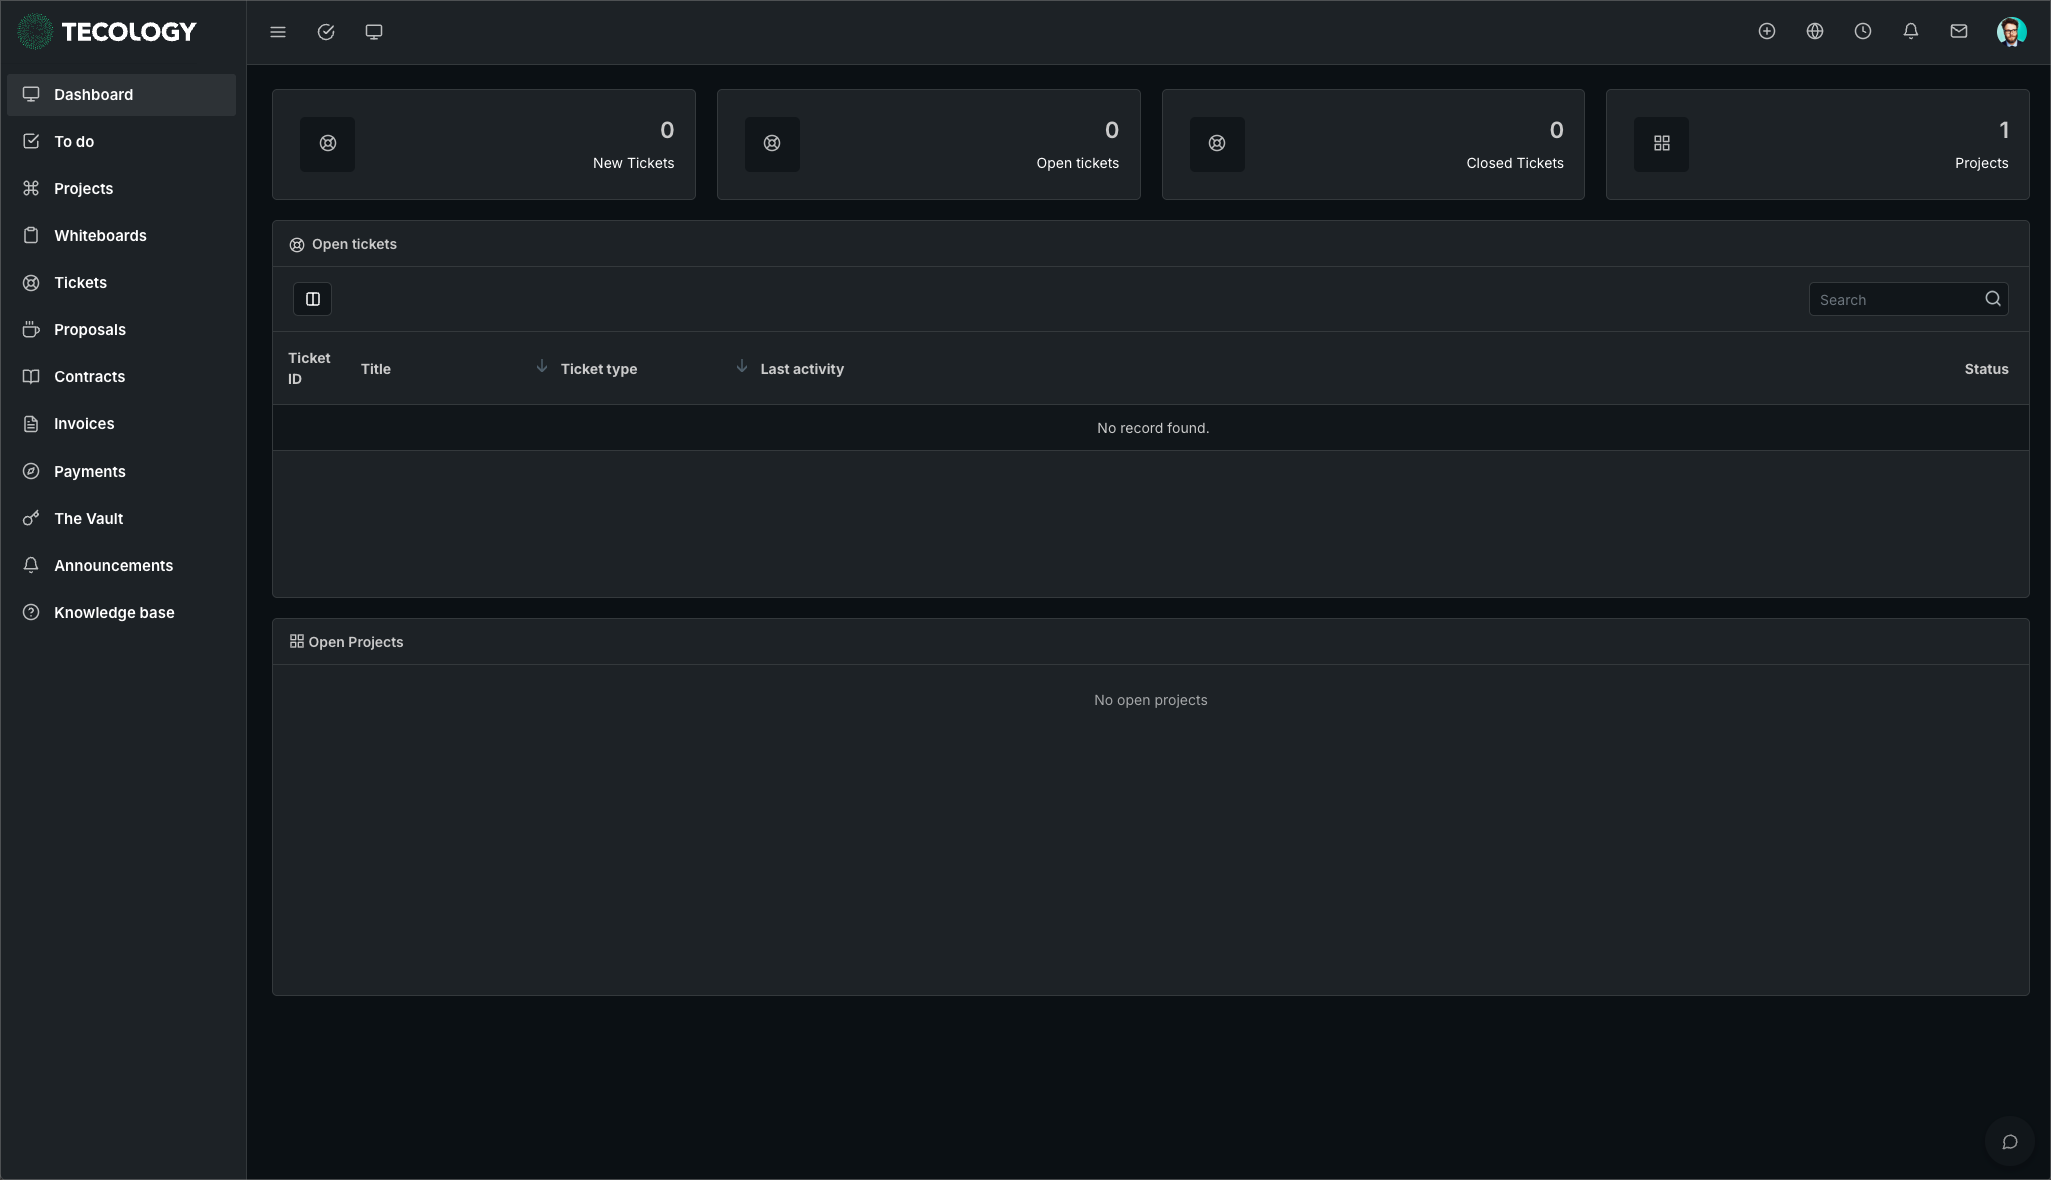
The dashboard is the main landing page you see when you log in to Tecology Workspace. It gives you a clear overview of activity across support, projects, files, and billing, and acts as the starting point for almost everything you do in the portal.
What the dashboard is for
The dashboard is designed to give you visibility at a glance. Rather than needing to search through different areas, it highlights recent activity and important updates so you can quickly see what’s happening.
What you’ll typically see on the dashboard
Depending on your access level, the dashboard may show:
- Recent or open support tickets
- Updates on active projects or tasks
- Notifications or activity indicators
- Quick access to key areas of the portal
You may not see every feature at all times, and that’s normal. The dashboard adapts based on what’s relevant to you.
Using the dashboard to get around
The dashboard acts as a central hub. From here, you can navigate to support tickets, projects, files, or billing without needing to remember where things live.
If you’re unsure where to go next, returning to the dashboard is usually the best place to start.
What you don’t need to worry about
Not every item on the dashboard requires action. Some information is shown purely for visibility or context.
If something does require your attention, it will usually be clear through status labels, notifications, or updates within the relevant section.
Next step
Spend a few moments clicking through the main areas linked from the dashboard to familiarise yourself with what’s available. When you need help or want to request something, the support section is always the best place to begin.